±Û·Î¹úºñÁî´Ï½ºÇаú
Ȳ¿í¿¬ ±³¼ö
ÇÁ·ÎÇÊ ±¸ºÐ¼± R Shiny Demo ±¸ºÐ¼± ¿¬±¸½ÇÀû ±¸ºÐ¼± ÄÁ¼³ÆÃ±¸ºÐ¼± °¶·¯¸®
02
RESEARCH
¿¬±¸ºÐ¾ß
 

Dong-A University

Department of Global Business

Google Scholar

YouTube Channel

LinkedIn


R Shiny Demo Home > R Shiny Demo  

1. The collaborative filtering approaches for the binary market basket data with the high dimensional cold-start problems

1.1. Pearson: Mild, A. and Reutterer, T. (2003), An Improved Collaborative Filtering Approach for Predicting Cross-Category Purchase Based on Binary Market Basket Data, Journal of Retailing and Consumer Services, 10(3), 123–133.

Source: https://www.researchgate.net/publication/221151296_Collaborative_Filtering_Methods_for_Binary_Market_Basket_Data_Analysis

1.2. Logistic Regression with Principal Component Analysis (PCA+LR): Lee, J. S., Jun, C. H., Lee, J. W., and Kim, S. Y. (2005), Classification-based collaborative filtering using market basket data, Expert Systems with Applications, 29(3), 700–704.

Source: https://www.sciencedirect.com/science/article/abs/pii/S0957417405000874

1.3. Random Forests (RF): Wook-Yeon Hwang, Chi-Hyuck Jun (2014), Supervised Learning-based Collaborative Filtering Using Market Basket Data for the Cold-start Problem, Industrial Engineering & Management Systems, 13(4), 421–431.

Source: http://www.iemsjl.org/journal/article.php?code=17201

1.4. Improved Pearson: Wook-Yeon Hwang (2018), Assessing New Correlation-Based Collaborative Filtering Approaches for Binary Market Basket Data, Electronic Commerce Research and Applications, 10(3), 12–18.

Source: https://www.sciencedirect.com/science/article/abs/pii/S1567422318300267

1.5. Conditional Probability-based Collaborative Filtering (CPBCF): Wook-Yeon Hwang (2025), New Conditional Probability-based Collaborative Filtering for the Binary Market Basket Data with the High Dimensional Cold-Start Problem, Information Sciences, Volume 689, 121475.

Source: https://www.sciencedirect.com/science/article/abs/pii/S0020025524013896?dgcid=author


2. The experimental design


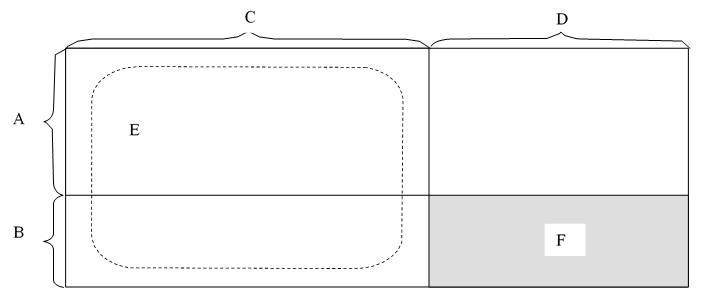
Division of the experimental data set for the improved CF approach

          A : Training users
          B : Active users
          C : Training items
          D : Active items
          E : Data for calculating the similarities between A and B in the improved CF approach
          F : Test data set

Figure. Division of the experimental data set for the CF approach.


3. R Shiny GUI instruction

- Upload a csv file comprising zeros and ones

- Select the number of the training users(A) and the proportion of the training items(C) in the sliders.

- The performance measure is based on the precision, which is generally used in information retrieval research and defined by


                                Precision =    Hitting number/Top-N                    

where Top-N is the number of first N items that are recommended by a CF scheme and ‘Hitting number’ is the actual Top-N obtained from the section F.

- The precision for Top-N (N=1,...,10) is calculated.


4. R Shiny GUI link: Click here


ºÎ»ê±¤¿ª½Ã ¼­±¸ ±¸´ö·Î 225(ºÎ¹Îµ¿ 2°¡) µ¿¾Æ´ëÇб³ ±¹Á¦´ëÇÐ ±Û·Î¹úºñÁî´Ï½ºÇаú   ¿¬±¸½Ç B5-0363È£ | TEL : 051-200-8711
Copyright @Donga-A University. All rights reserved.